Build Platform dashboard
The Build Platform dashboard displays information about session usage, as well as live and past session data. It displays similar details to the Meetings dashboard, but specific to Build account products.
This document highlights the differences between the Build product dashboard and the Meetings dashboard. For more information about the Meetings dashboard, see Getting started using the Zoom Dashboard in the Zoom Help Center.
Dashboard data update and retention
- Dashboard data updates daily at 12:00 GMT.
- The Dashboard retains 12 months of data.
Get started
- Sign in to your Build account web portal.
- Click Dashboard in the navigation menu.
Definitions
Sessions are the fundamental building blocks of the Build platform. A session typically connects two or more users so they can communicate over video or audio, similar to a virtual meeting.
- Video SDK sessions can include features, such as chat, screen share, and live streaming.
- Cobrowse SDK sessions provide a shared virtual space where agents and users can navigate and interact with web pages together to collaborate. Features include remote assist and data mask.
Session minutes are used for billing purposes and are calculated based on the number of participants and their connection time in a session. This metric can also be thought of as participant minutes, since it represents the total number of minutes that all participants were connected.
Examples of session minute calculation
| Minutes of connection per participant | Calculation | Session minutes |
|---|---|---|
| 10:00, 10:00, 10:00 | SUM(10, 10, 10) | 30 |
| 10:00, 09:06, 03:20 | SUM(10, 10, 4) | 24 |
Note: Partial minutes are rounded up to the nearest whole minute.
Dashboard tab
The Dashboard tab displays information about sessions. This is similar to the Meetings tab in the Meetings dashboard. See Dashboard for meetings and webinars for details.
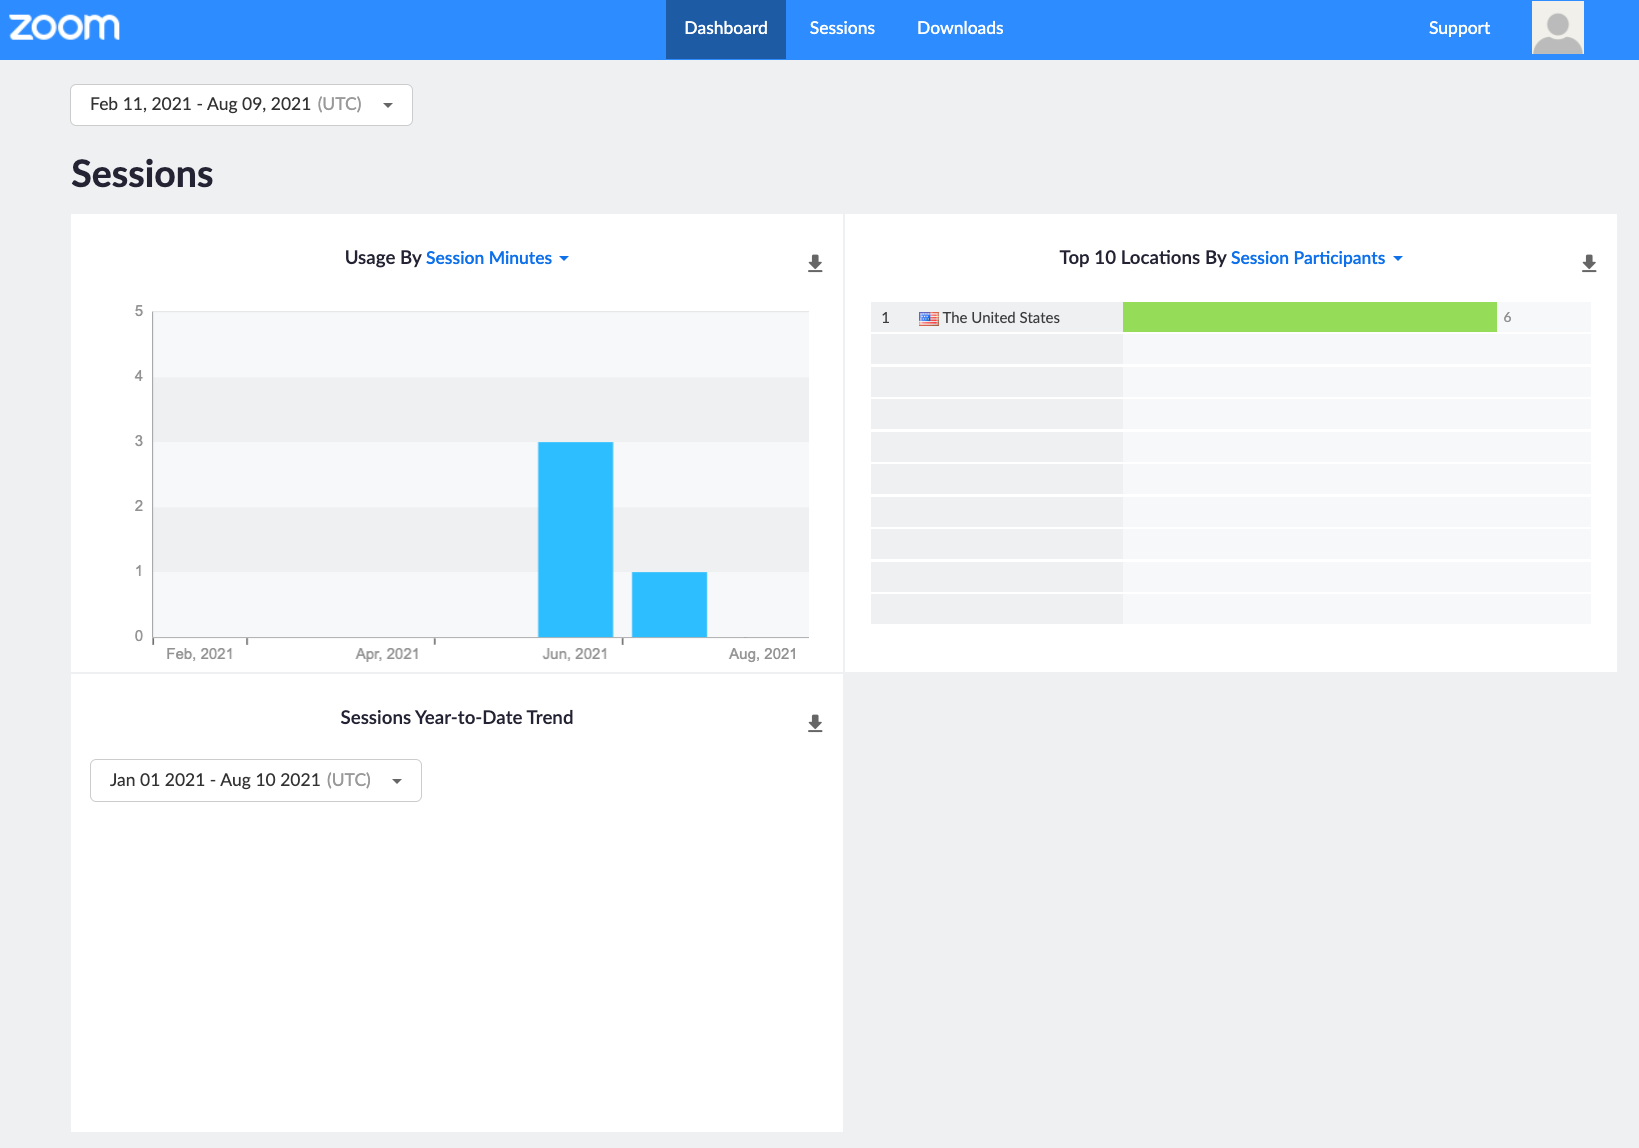
The key difference between the Build account dashboard and the Meetings dashboard is that the Build account dashboard displays:
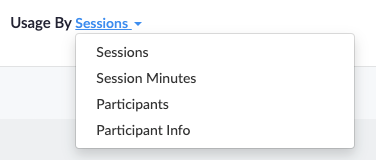
- Usage by Sessions, Session Minutes, Participants, or Participant Info
- Top 10 Locations By Session Participants
- Sessions Year-to-Date Trend
You can download all of this data to CSV files just as you can on the Meeting dashboard. The Downloads tab lists the CSV files.
Sessions tab
There's a Video Sessions tab and a Cobrowse Sessions tab. They are structured similarly and display information for each product. Each tab shows data about live or past sessions. Click Live Sessions to show all live sessions. Click Past Sessions to view up to a month's worth of data about past sessions. On the Past Sessions tab, choose a range of up to 30 days in the date selector.
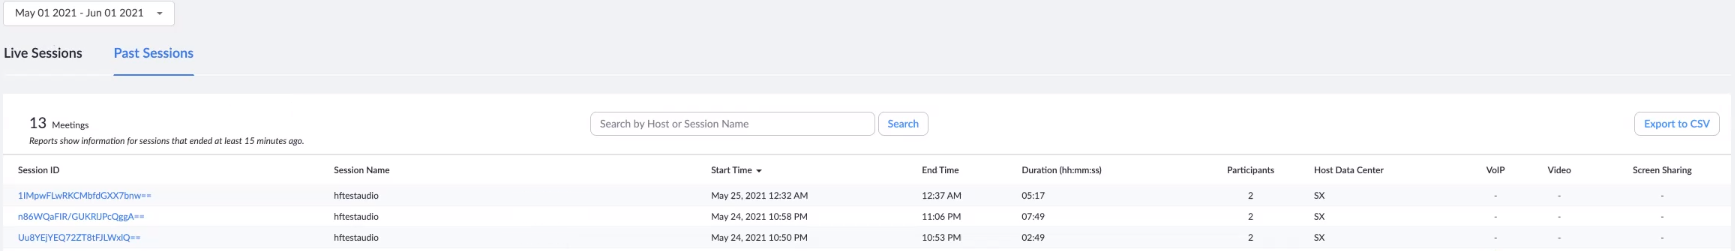
The tables display the following data. The Product column indicates whether the column is in the Video SDK session (Video), Cobrowse SDK session (Cobrowse), or both tabs.
| Column | Product | Description |
|---|---|---|
| Session Pin | Cobrowse | Generated when creating a session, used for the other party to join the session. |
| Session ID | Both | The internal representation of a session. This is unique for each session. If you have issues with the session, use this ID when you contact Zoom Support. |
| Session Key | Video | The optional value set by the developer in the JWT to identify the session. |
| Meeting Quality, Audio Quality, Video Quality, Screen Share Quality | Video | Session quality scores. |
| Start Time | Both | The time the host started the session. |
| Customer username | Cobrowse | The name the customer used in the session. |
| Agent username | Cobrowse | The name the agent used in the session. |
| Duration | Both | The session duration, in hours, minutes, and seconds (hh:mm:ss). Note that sessions under an hour will not display the hours. For example, a 5-minute session will be displayed as "05:00". Note that live sessions display this as the current duration. |
| Number of Agents (Past Sessions) | Cobrowse | The number of agents that were in the session. |
| End Time | Video | The time the host ended the session. |
| Users | Video | The number of participants in the session. |
| VoIP | Video | Indicates whether a participant used Voice over Internet Protocol. |
| Video | Video | Indicates whether a participant used video. |
| Screen Sharing | Video | Indicates whether a participant used screen sharing. |
| Recording | Video | Whether there is a recording. |
Note: For VoIP, Video, and Screen Sharing, icons indicate that a participant used these features. A dash indicates that a participant did not use these features.
Session details
For Video SDK sessions, click a session's ID to display more information about the session.
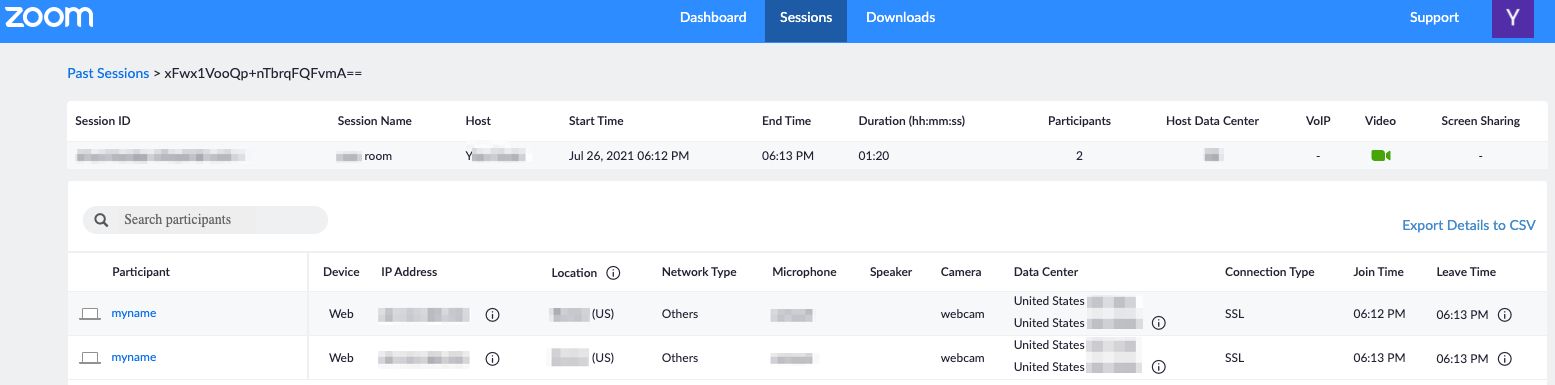
The top of the page displays the session information from the previous page. The rest of the page displays the following details about the participants.
- Participant — The participant's display name.
- Device — The device the participant used to connect to the session.
- IP Address — The participant's public IP address. Mouse-over the information icon to view the local IP address.
- Location — The participant's geographical location.
- Network Type — The network connection recognized by Zoom: Wired, Wifi, PPP (Point-to-Point), or Cellular (3G, 4G, and 5G cellular). If the network is not recognized, this value will be "Others".
- Microphone — The microphone device detected by the client.
- Speaker — The speaker device detected by the client.
- Camera — The camera device detected by the client.
- Data Center — The Zoom Data Center that the participant connected to for the session. The Real-Time Web Gateway (RWG) helps participants who join sessions from a web browser connect to the Zoom Global Network.
- Connection Type — The data protocol type that the participant used or is using to connect.
- Join Time — The time the participant joined the session.
- Leave Time — The time the participant left the session. Mouse-over the information icon to view the reason why the participant left.
Participant details
For Video SDK, click a participant's name to display more information about them.
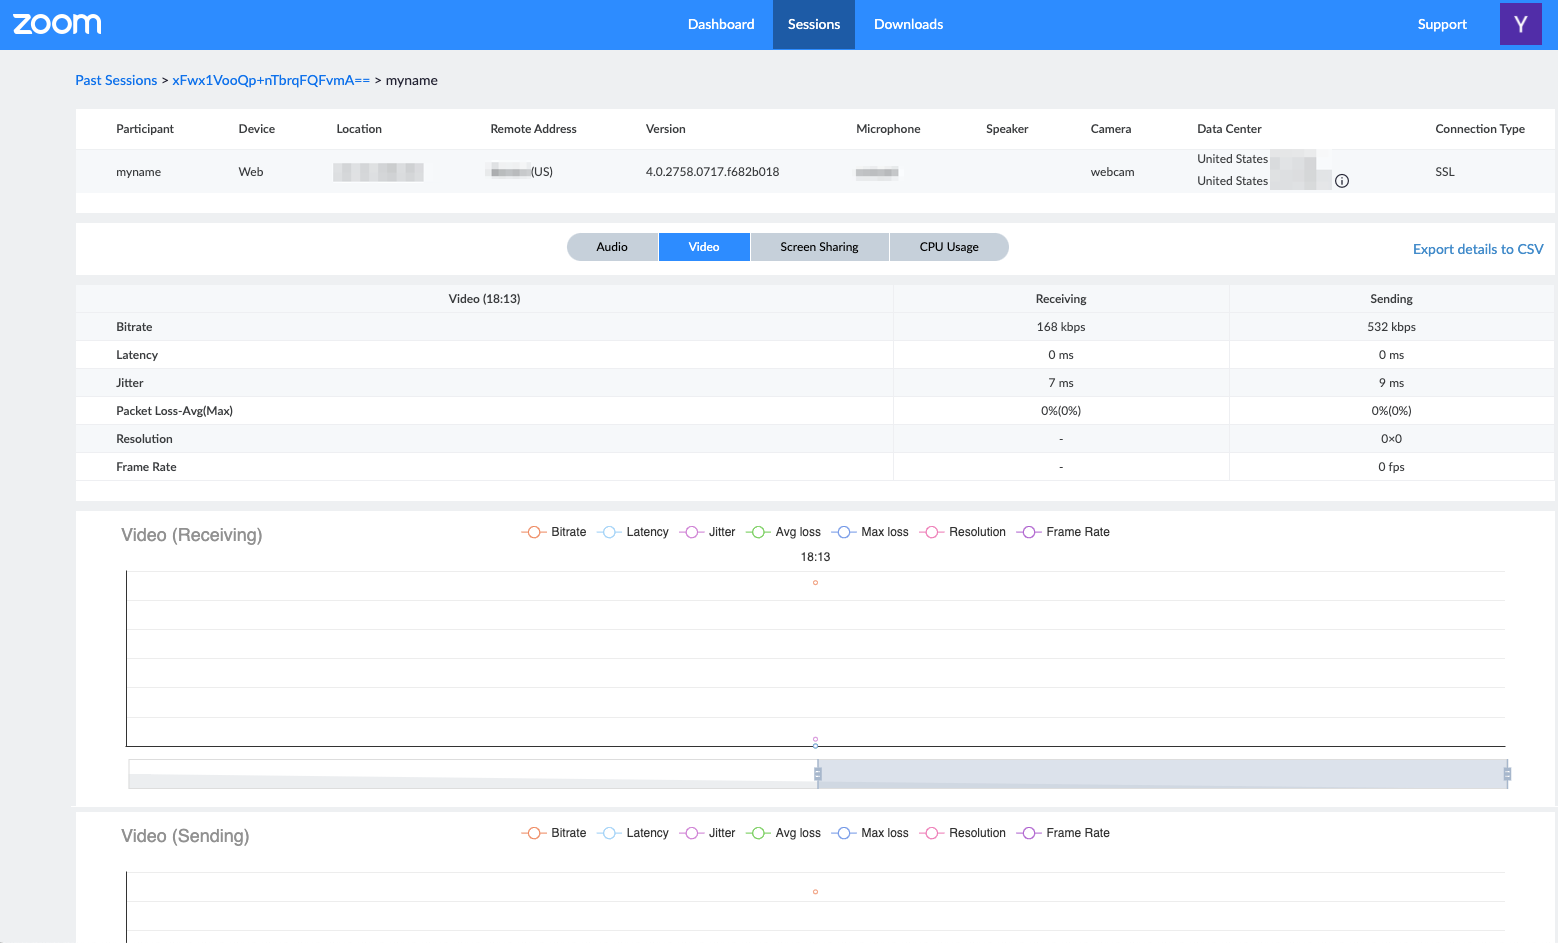
The top of the page displays the participant's information from the previous page. The rest of the page displays information about the Audio, Video, Screen Sharing, and CPU Usage. Click each tab to view these details.
The Audio, Video, and Screen Sharing tabs include the following information about the Receiving and Sending quality of the session.
- Bitrate — The number of bits per second transmitted over the network, in Kbps.
- Latency — The amount of time it takes for a packet to travel from one point to another, in milliseconds.
- Jitter — The variation in the delay of received packets, in milliseconds.
- Packet Loss — The average and maximum amounts of packets that failed to arrive at their destination. This is expressed as the percentage of packets that fail to arrive at their destination.
The Video and Screen Sharing tabs include the following information about the sending and receiving.
- Resolution — The number of pixels in each dimension supported by your camera or screen.
- Frame Rate — The frame rate at which your camera can produce unique images. Zoom supports a frame rate of up to 30 frames per second (FPS).
CPU Usage
Displays information about the CPU usage of the Zoom instance (the Zoom Client or SDK) on the user's device.
- Zoom minimum CPU usage
- Zoom average CPU usage
- Zoom maximum CPU usage
- System maximum CPU usage
Graphs
This interface also includes graphs that display this information. Use the slider below a graph to increase or decrease the time range in focus.
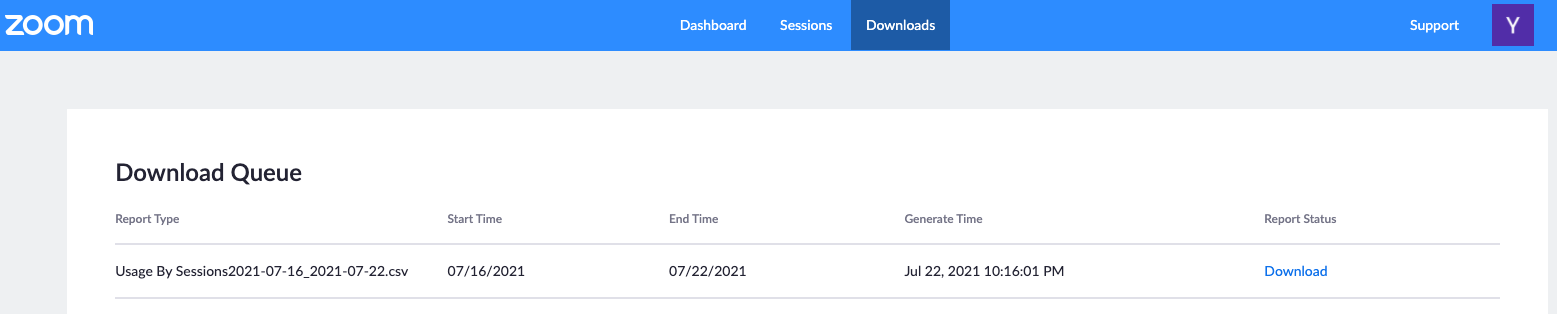
Downloads tab
The Downloads tab displays the CSV files of the data you chose to export from the Dashboard and Sessions tabs.
- Report Type — The report's name.
- Start Time and End Time — The report's date range.
- Generate Time — The time at which the report was generated.
- Report Status — The report's status. For example, if the report is ready for download, the report status is "Download".
External accounts management
Build account administrators can give Zoom account holders access to view their dashboard and view or manage other account activities with external accounts management control. See Roles for details.