Debugging Zoom apps for mobile devices
Zoom supports the use of standard industry tools and processes for debugging mobile apps on Android and iOS.
The standard setup for testing mobile apps includes:
- Enable debugging in the Zoom web settings.
- Connect a USB cable from the mobile device to your development machine.
- Enable debugging in the development system and mobile devices.
Enable debugging in Zoom web settings
-
Log into the Zoom web portal as the account admin.
-
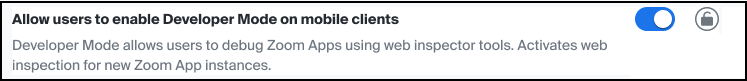
Go to Admin > Account Management > Account Settings, > Zoom Apps, and enable Allow users to enable Developer Mode on mobile clients.
-
Log into the Zoom web portal as the testing account.
-
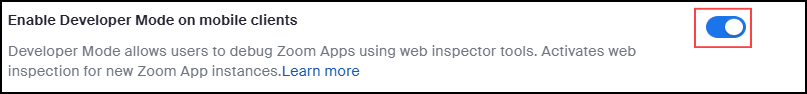
Go to Settings > Zoom Apps, and enable Enable Developer Mode on mobile clients.
Debug apps for Android
Prerequisites
- You have installed Zoom client 6.2.0 or higher on your Android test device.
- You are logged into the Zoom client.
- You have installed Chrome on your development system.
- You have enabled debugging in the Zoom web settings.
- You have connected your mobile device to your development system with a USB cable.
Enable USB Debugging
- Connect a USB cable to your Android device.
- On your Android device, open Developer Options and select Enable USB Debugging. Note: On Android 4.1 and lower, the Developer Options screen is available by default. On Android 4.2 and higher, you must enable this screen.
- On your development machine, open Chrome and go to
chrome://inspect#devices. - Make sure Discover USB devices is enabled.
- Open Chrome on your Android device.
- On your development machine,
chrome://inspect/#devicesdisplays your Android device. - In the Open tab with url field, enter a URL and then click Open. The page opens in a new tab on your Android device.
- Click Inspect next to the URL that you just opened. A new DevTools instance opens.
For more information about debugging mobile apps on Android, see Remote debug Android devices.
Debug apps for iOS
We recommend using the set of web development tools in Safari's Web Inspector to debug issues when testing your Zoom Apps on iOS and iPadOS. For convenience in this article, we refer to iOS and iPadOS devices as "test devices".
Prerequisites
- You have installed Zoom client 6.2.0 or higher on your iOS/iPadOS test device.
- You are logged into the Zoom client.
- You have the Safari browser on your iOS/iPadOS test device and Mac.
- You have enabled debugging in the Zoom web settings.
- You have connected your mobile device to development system with a USB cable.
-
Connect the test device to the Mac with a USB cable.
-
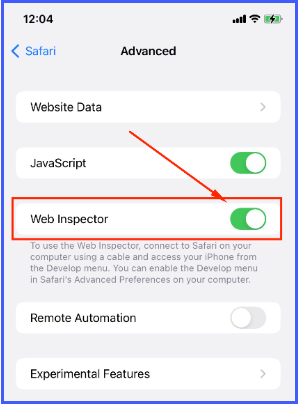
On the test device, enable Web Inspector:
Go to Setting > Safari > Advanced, and enable Web Inspector.
-
On the Mac desktop, set Safari to display JSContexts from the test device:
-
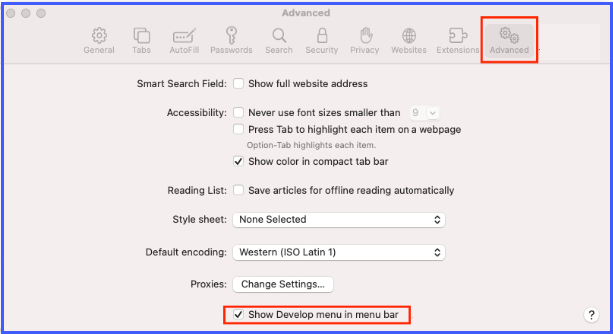
Set Safari to display the Develop menu item in the menu bar.
Launch Safari and go to Preferences > Advanced.
Enable Show Develop menu in menu bar, and then close Preferences.
-
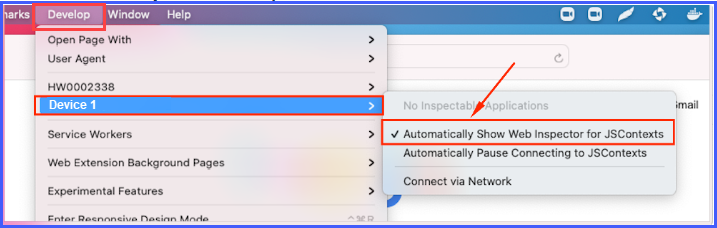
In Safari, from the menu bar click Develop.
Select your device and enable Automatically Show Web Inspector for JSContexts.
-
-
Use Safari's Web Inspector on your Mac to debug your Zoom App.
- On your iOS test device, launch the Zoom client and open your app.
- On your Mac, launch Safari, click Develop, and select your iOS test device.
- Select your app's home URL.
You can now use the displayed information in Web Inspector to debug your app.
For more information about debugging apps on iOS devices, follow the instructions in Inspecting iOS and iPadOS.